Build the view that fits how you work
A Custom Dashboard is a grid of panels — each one a widget driven by a database query. Every user builds as many dashboards as they need and arranges them in an explicit layout.
Try Demo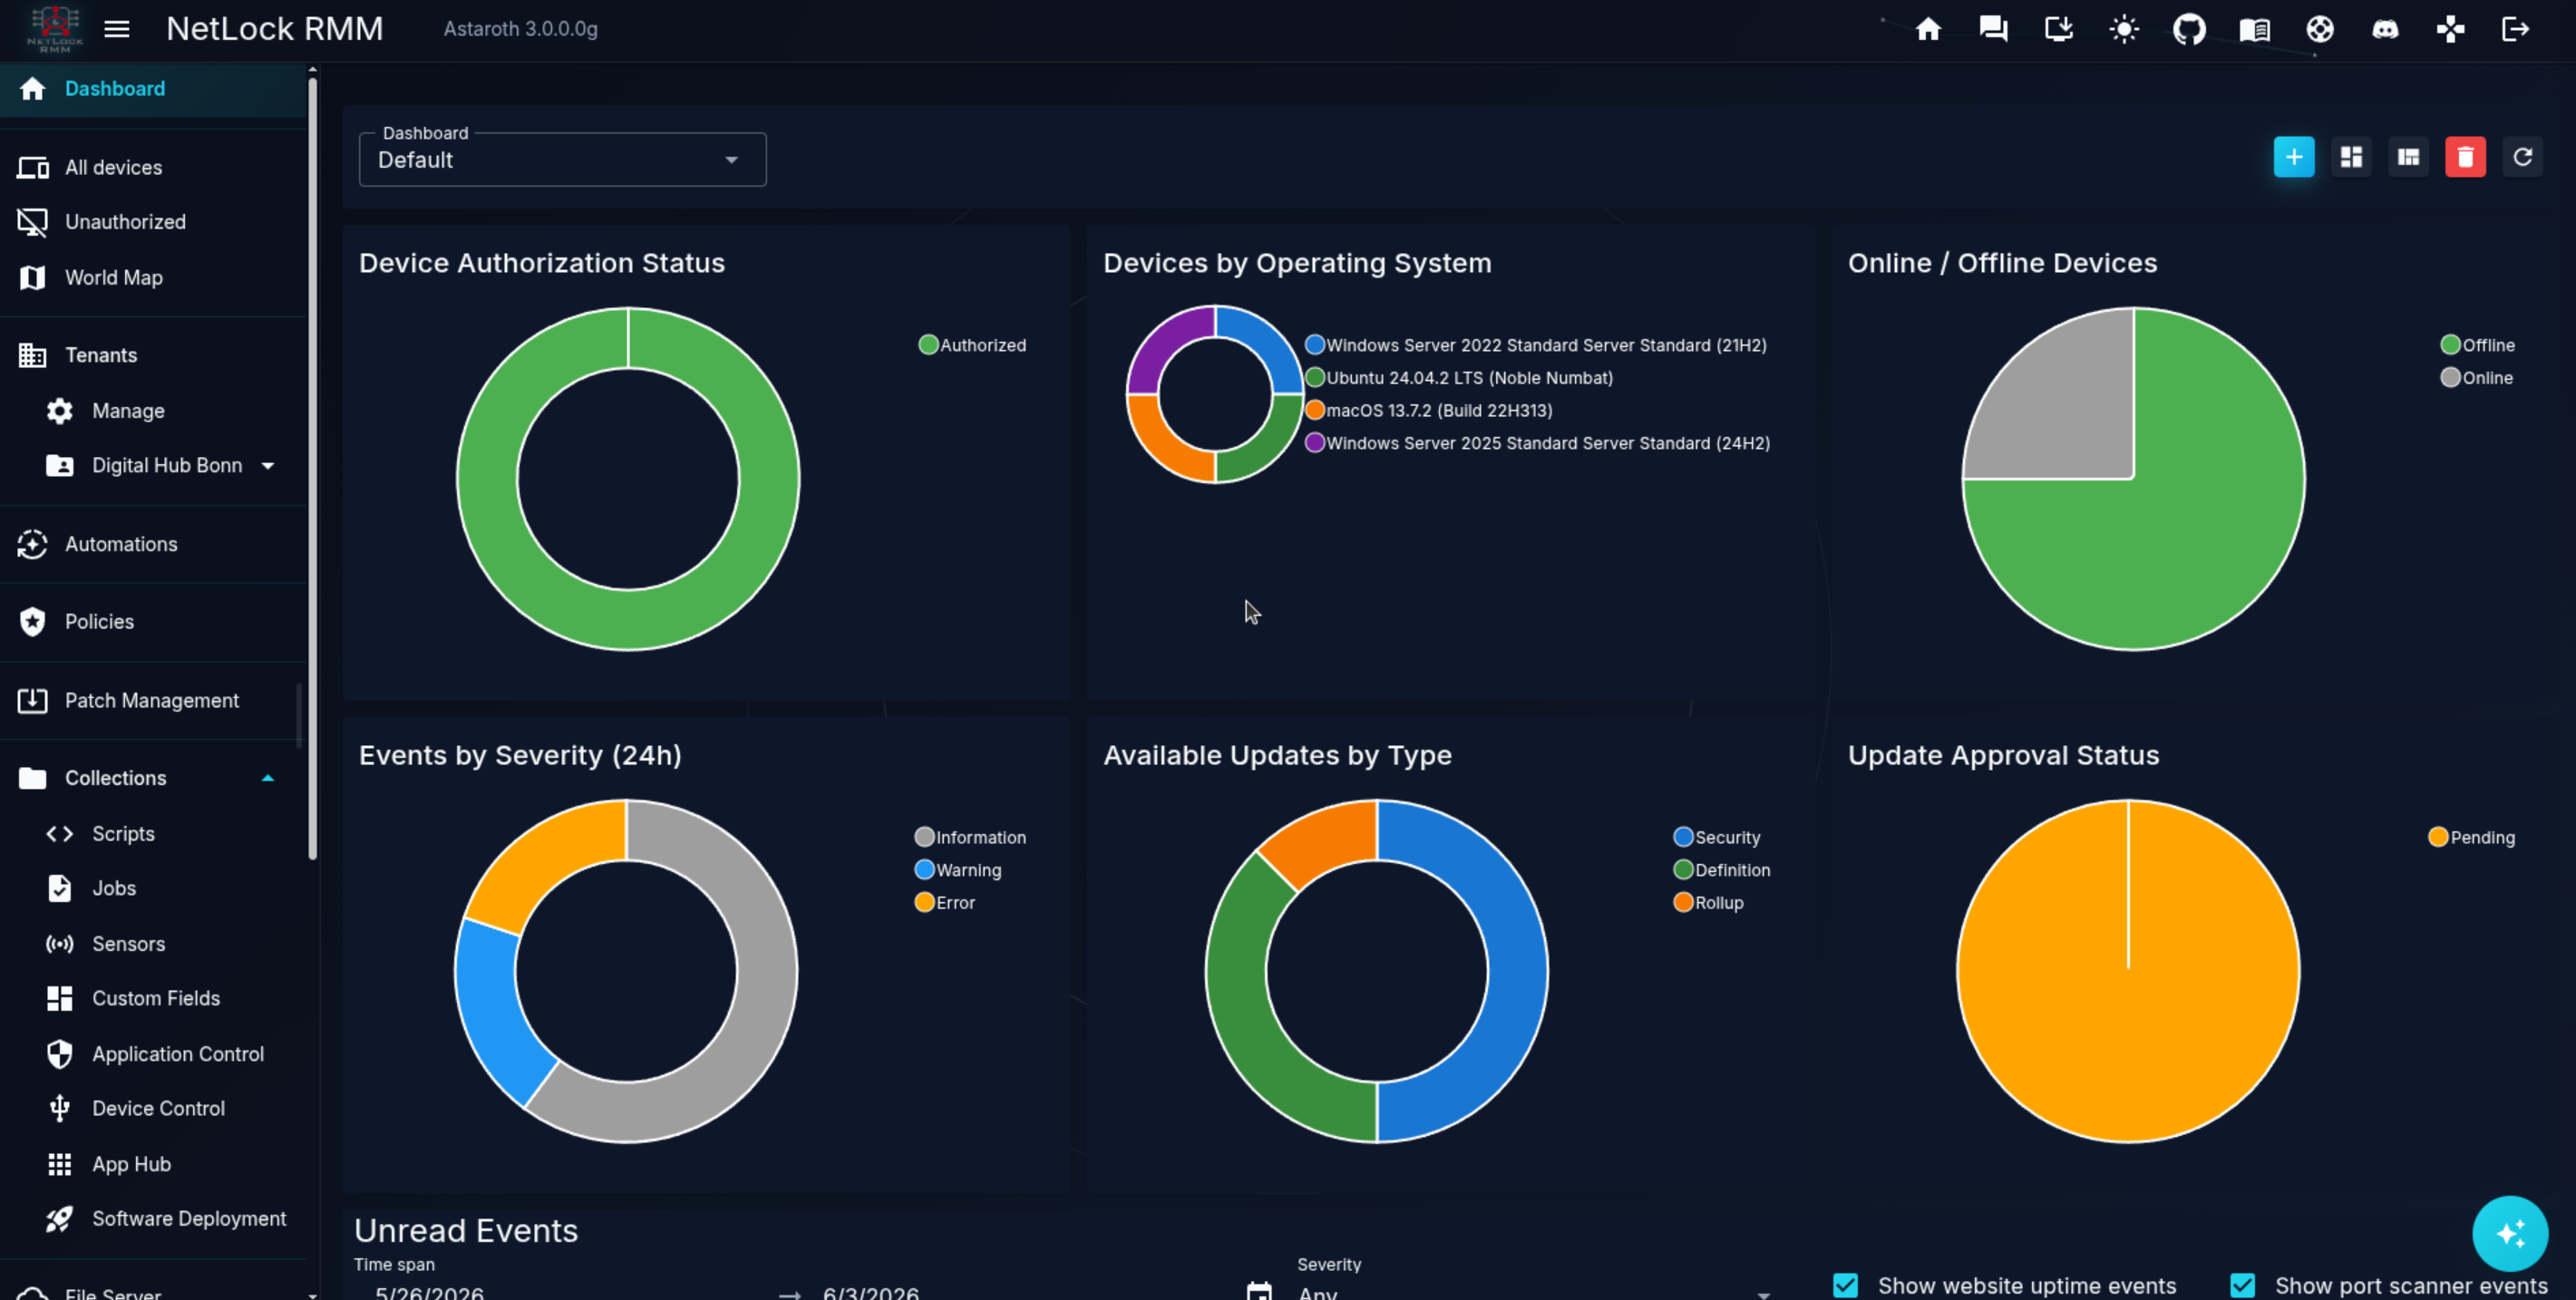
A grid of panels, arranged your way
Drop in panels, size them on a twelve-column grid, and switch to Edit Layout mode to rearrange.
Two panel types, six chart styles
Every panel renders database data as a chart or a table.
From query to panel
The Panel Builder turns a database query into a finished, styled widget.
SQL query builder
Compose the panel's data with aggregates, filters, joins, and ordering — visually or in raw SQL.
Column mapping
Map result columns to the panel's label and value so the chart or table reads correctly.
Display & sizing
Tune colours, legend, axes, fill, and tension, and size the panel on a 12-column grid from 200 to 1200 pixels tall.
Your dashboards, your way
Dashboards are personal — every operator curates their own set.
- Create as many dashboards as you need, switched from the dashboard bar
- Rearrange panels freely in Edit Layout mode
- Every panel only ever shows data your permissions allow
Dashboards for every role
A few of the ways teams put Custom Dashboards to work.
MSP tenant overview
A per-tenant dashboard showing device counts, open alerts, and patch posture at a glance.
Post-rollout watch list
A quiet dashboard that tracks the handful of metrics that matter right after a change.